Why describing with code instead of drawing by hand?
For a long time I was looking for something that would let me easily create diagrams of my software design. Most of the available software focuses on drawing: inserting boxes and connecting them with arrows by hand. That doesn't work for me because of two reasons:
- things change over time,
- it's a challenge to keep things organised as they scale.
If documenting software is too complicated and time consuming, people stop doing that at all. You need a documentation that lives next to the source code, can be easily altered and auto-generated at will (preferably on every build).
Why Python?
Simple, concise, elegant language that allows you to use only the features you need at the moment. You can write a simple script to fetch weather from webservice service in (literally) two lines of code. You can also write your next Facebook Meta-killer app with it.
Why Python is the best for this particular job:
- Jupyter Notebook. If you haven't heard of it, imagine an executable document that can generate graphs, call external services and use pretty much any Python module out there. At the same time it's easy to read and easy to modify on the fly. So you have a living documentation that can keep up with your code.
- Tons and tons of modules available just by adding one line to
requirements.txt. No dependency hell, complex syntax and quirky builders. - Runs anywhere. The standard way of deploying Python code (meaning:
virtualenvandpip) enables you to run it seamlessly on pretty much any machine with Python installed.
Sounds great, but enough of this 🗣️ and more of this ✍ please.
Okay, let's see it in action.
To start using Diagrams, you first need to install it (I assume you already have Python installed on your machine). We'll start with creating virtual environment and activating it:
python3 -m venv ./venv
source ./venv/bin/activate
pip install graphviz # required
pip install diagrams
touch diagram.py # creates diagram.py in current working directory
And we're good to go! Now, let's edit diagram.py:
from diagrams import Diagram
from diagrams.aws.compute import EC2
from diagrams.aws.database import RDS
from diagrams.aws.network import ELB

with Diagram("Web Service", show=False):
    ELB("lb") >> EC2("web") >> RDS("userdb")
If everything went as expected - after running this script, web_service.png should appear in your working directory. Let's take a quick look at it:
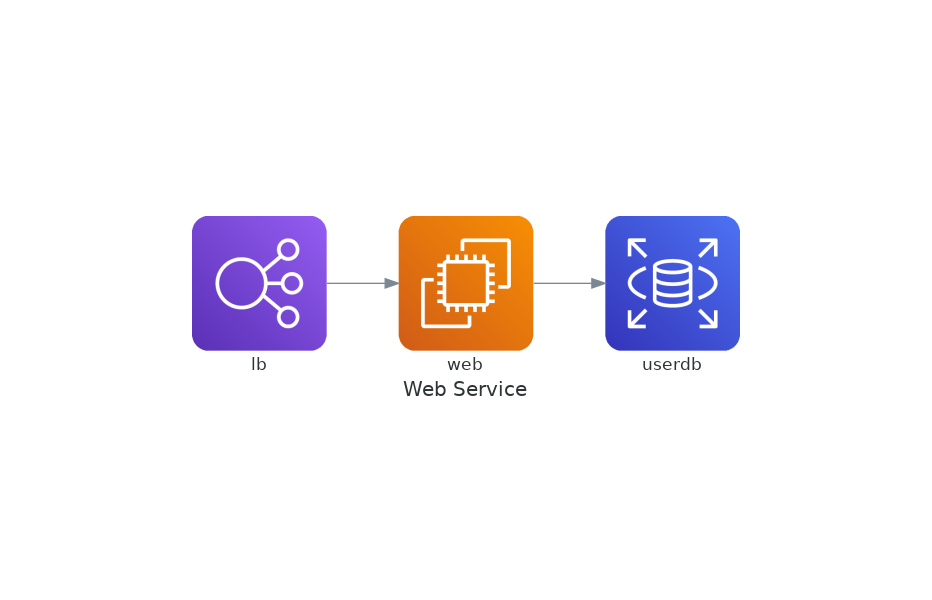
Isn't that amazing?
How about clusters? Sure, let's do that:
from diagrams import Diagram
from diagrams.aws.compute import EC2
from diagrams.aws.database import RDS
from diagrams.aws.network import ELB

with Diagram("Web Service", show=False):

    with Cluster("DB Cluster"):
        db_main = RDS("userdb")
        db_main - [RDS("userdb ro")]

    ELB("lb") >> EC2("web") >> db_main
Need some labels to help you understand the diagram? Here they are:
from diagrams import Diagram
from diagrams.aws.compute import EC2
from diagrams.aws.database import RDS
from diagrams.aws.network import ELB

with Diagram("Web Service", show=False):

    with Cluster("DB Cluster"):
        db_main = RDS("userdb")
        db_main - [RDS("userdb ro")]

    ELB("lb") >> EC2("web") >> Edge(label="store") >> db_main
Have some custom icons that you'd like to add? Of course!
from urllib.request import urlretrieve

from diagrams import Cluster, Diagram
from diagrams.aws.database import Aurora
from diagrams.custom import Custom
from diagrams.k8s.compute import Pod

# Download an image to be used into a Custom Node class
rabbitmq_url = "https://jpadilla.github.io/rabbitmqapp/assets/img/icon.png"
rabbitmq_icon = "rabbitmq.png"
urlretrieve(rabbitmq_url, rabbitmq_icon)

with Diagram("Broker Consumers", show=False):
    with Cluster("Consumers"):
        consumers = [
            Pod("worker"),
            Pod("worker"),
            Pod("worker")]

    queue = Custom("Message queue", rabbitmq_icon)

    queue >> consumers >> Aurora("Database")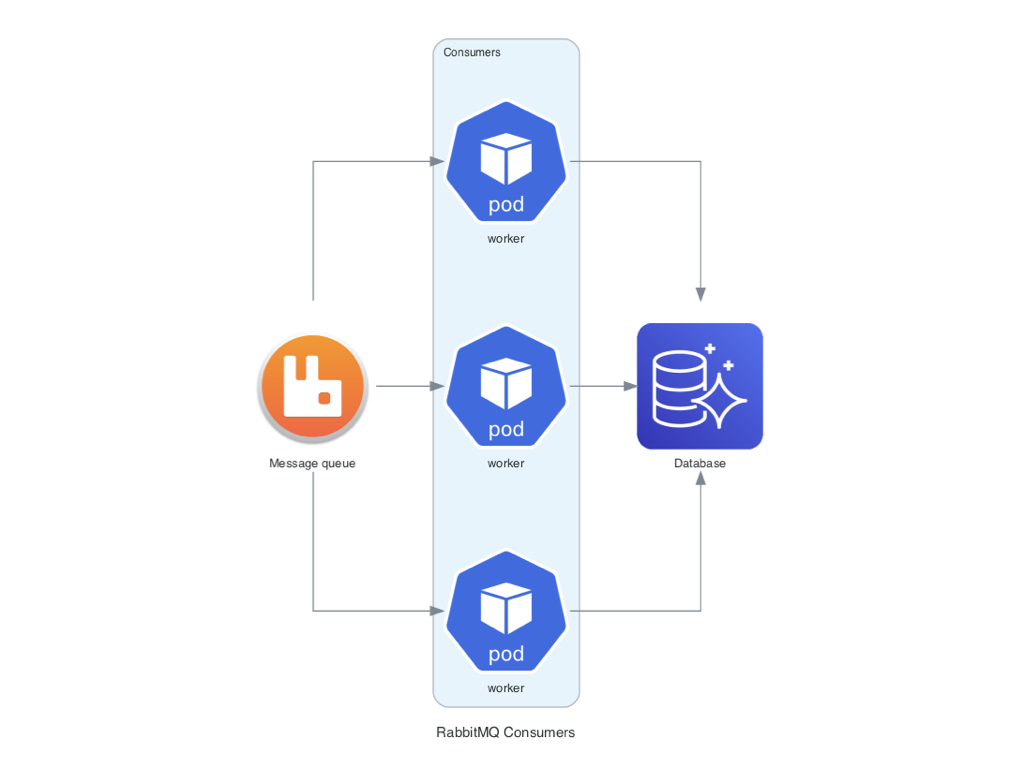
As you can see, it's both simple and powerful at the same time. It works great for my projects and I encourage you to try it yourself.